Pregnancy, postnatal & infant wellbeing, mental health & substance-related harm
If you work in primary care or mental health specialist teams supporting pregnant and postnatal people with their wellbeing or maternal mental health and addiction needs, you’ll find training, workshops, and resources here to support your mahi.

Partners


Pregnancy, postnatal & infant wellbeing, mental health & substance-related harm


.webp)
Oops! No resources found. Please try again.
Oops! No resources found. Please try again.
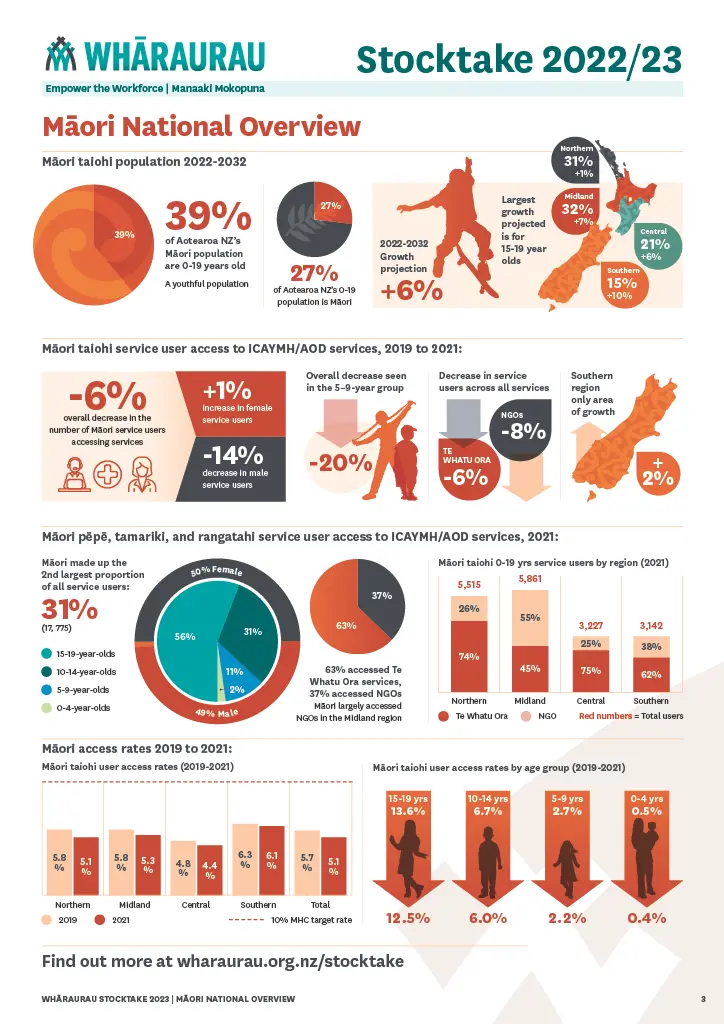
Stocktake dashboard
Find workforce data and access rates of our young people to mental health and addiction services.
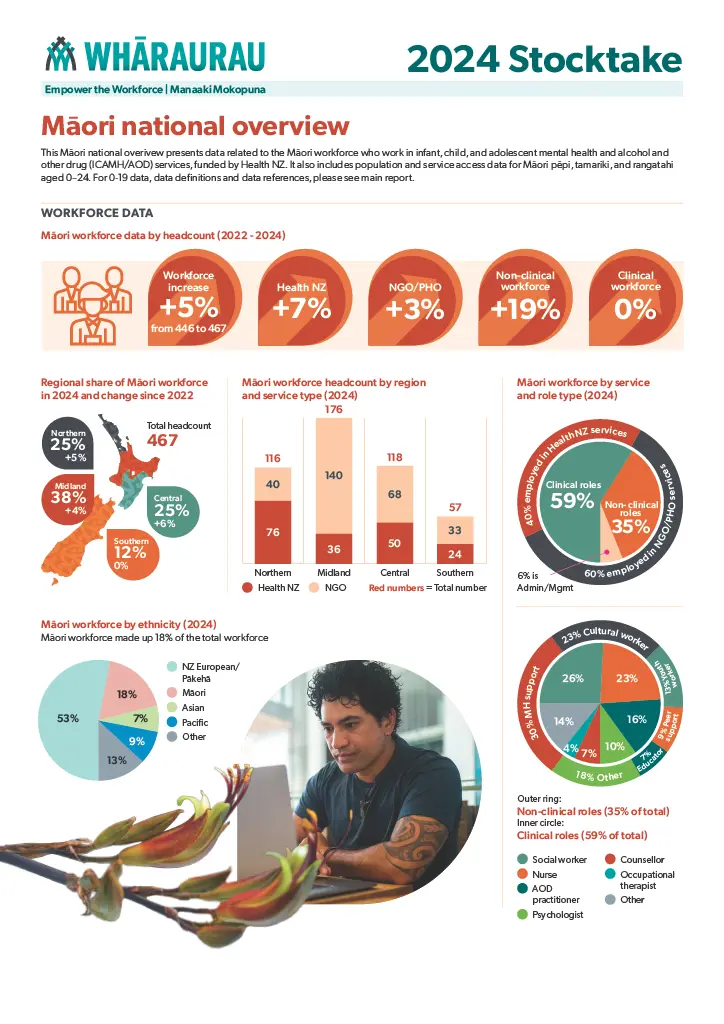
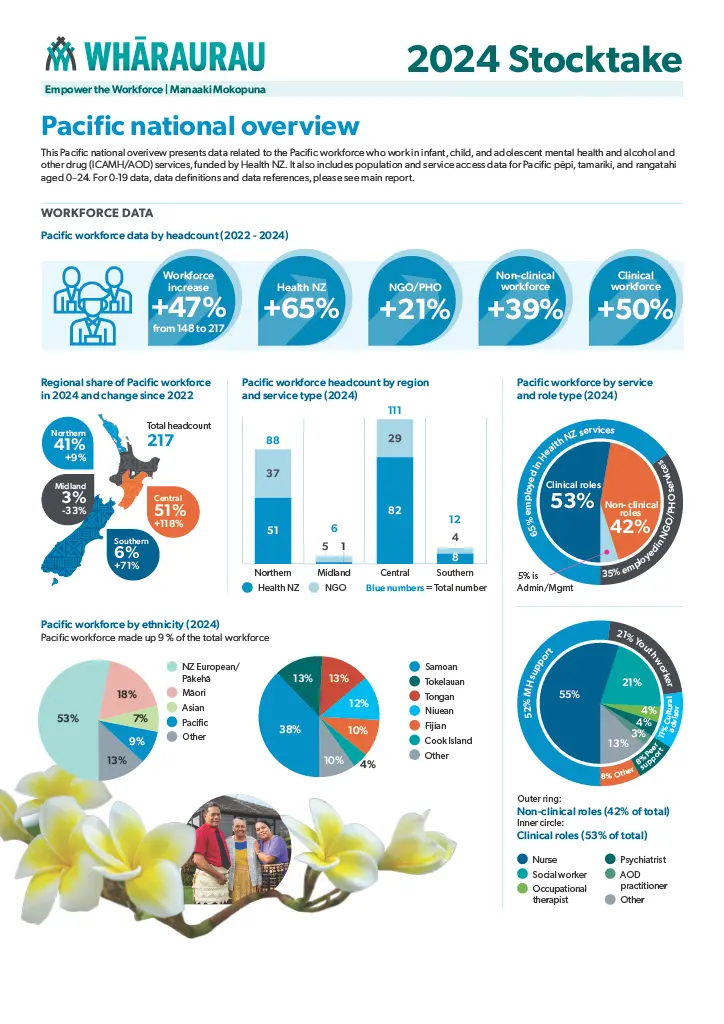
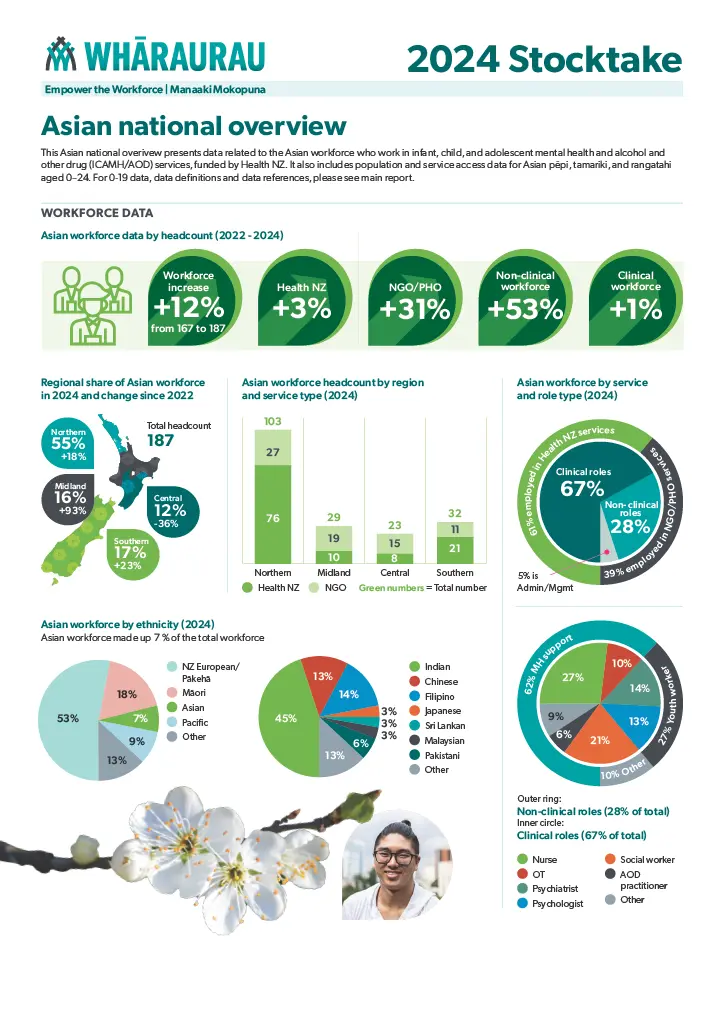
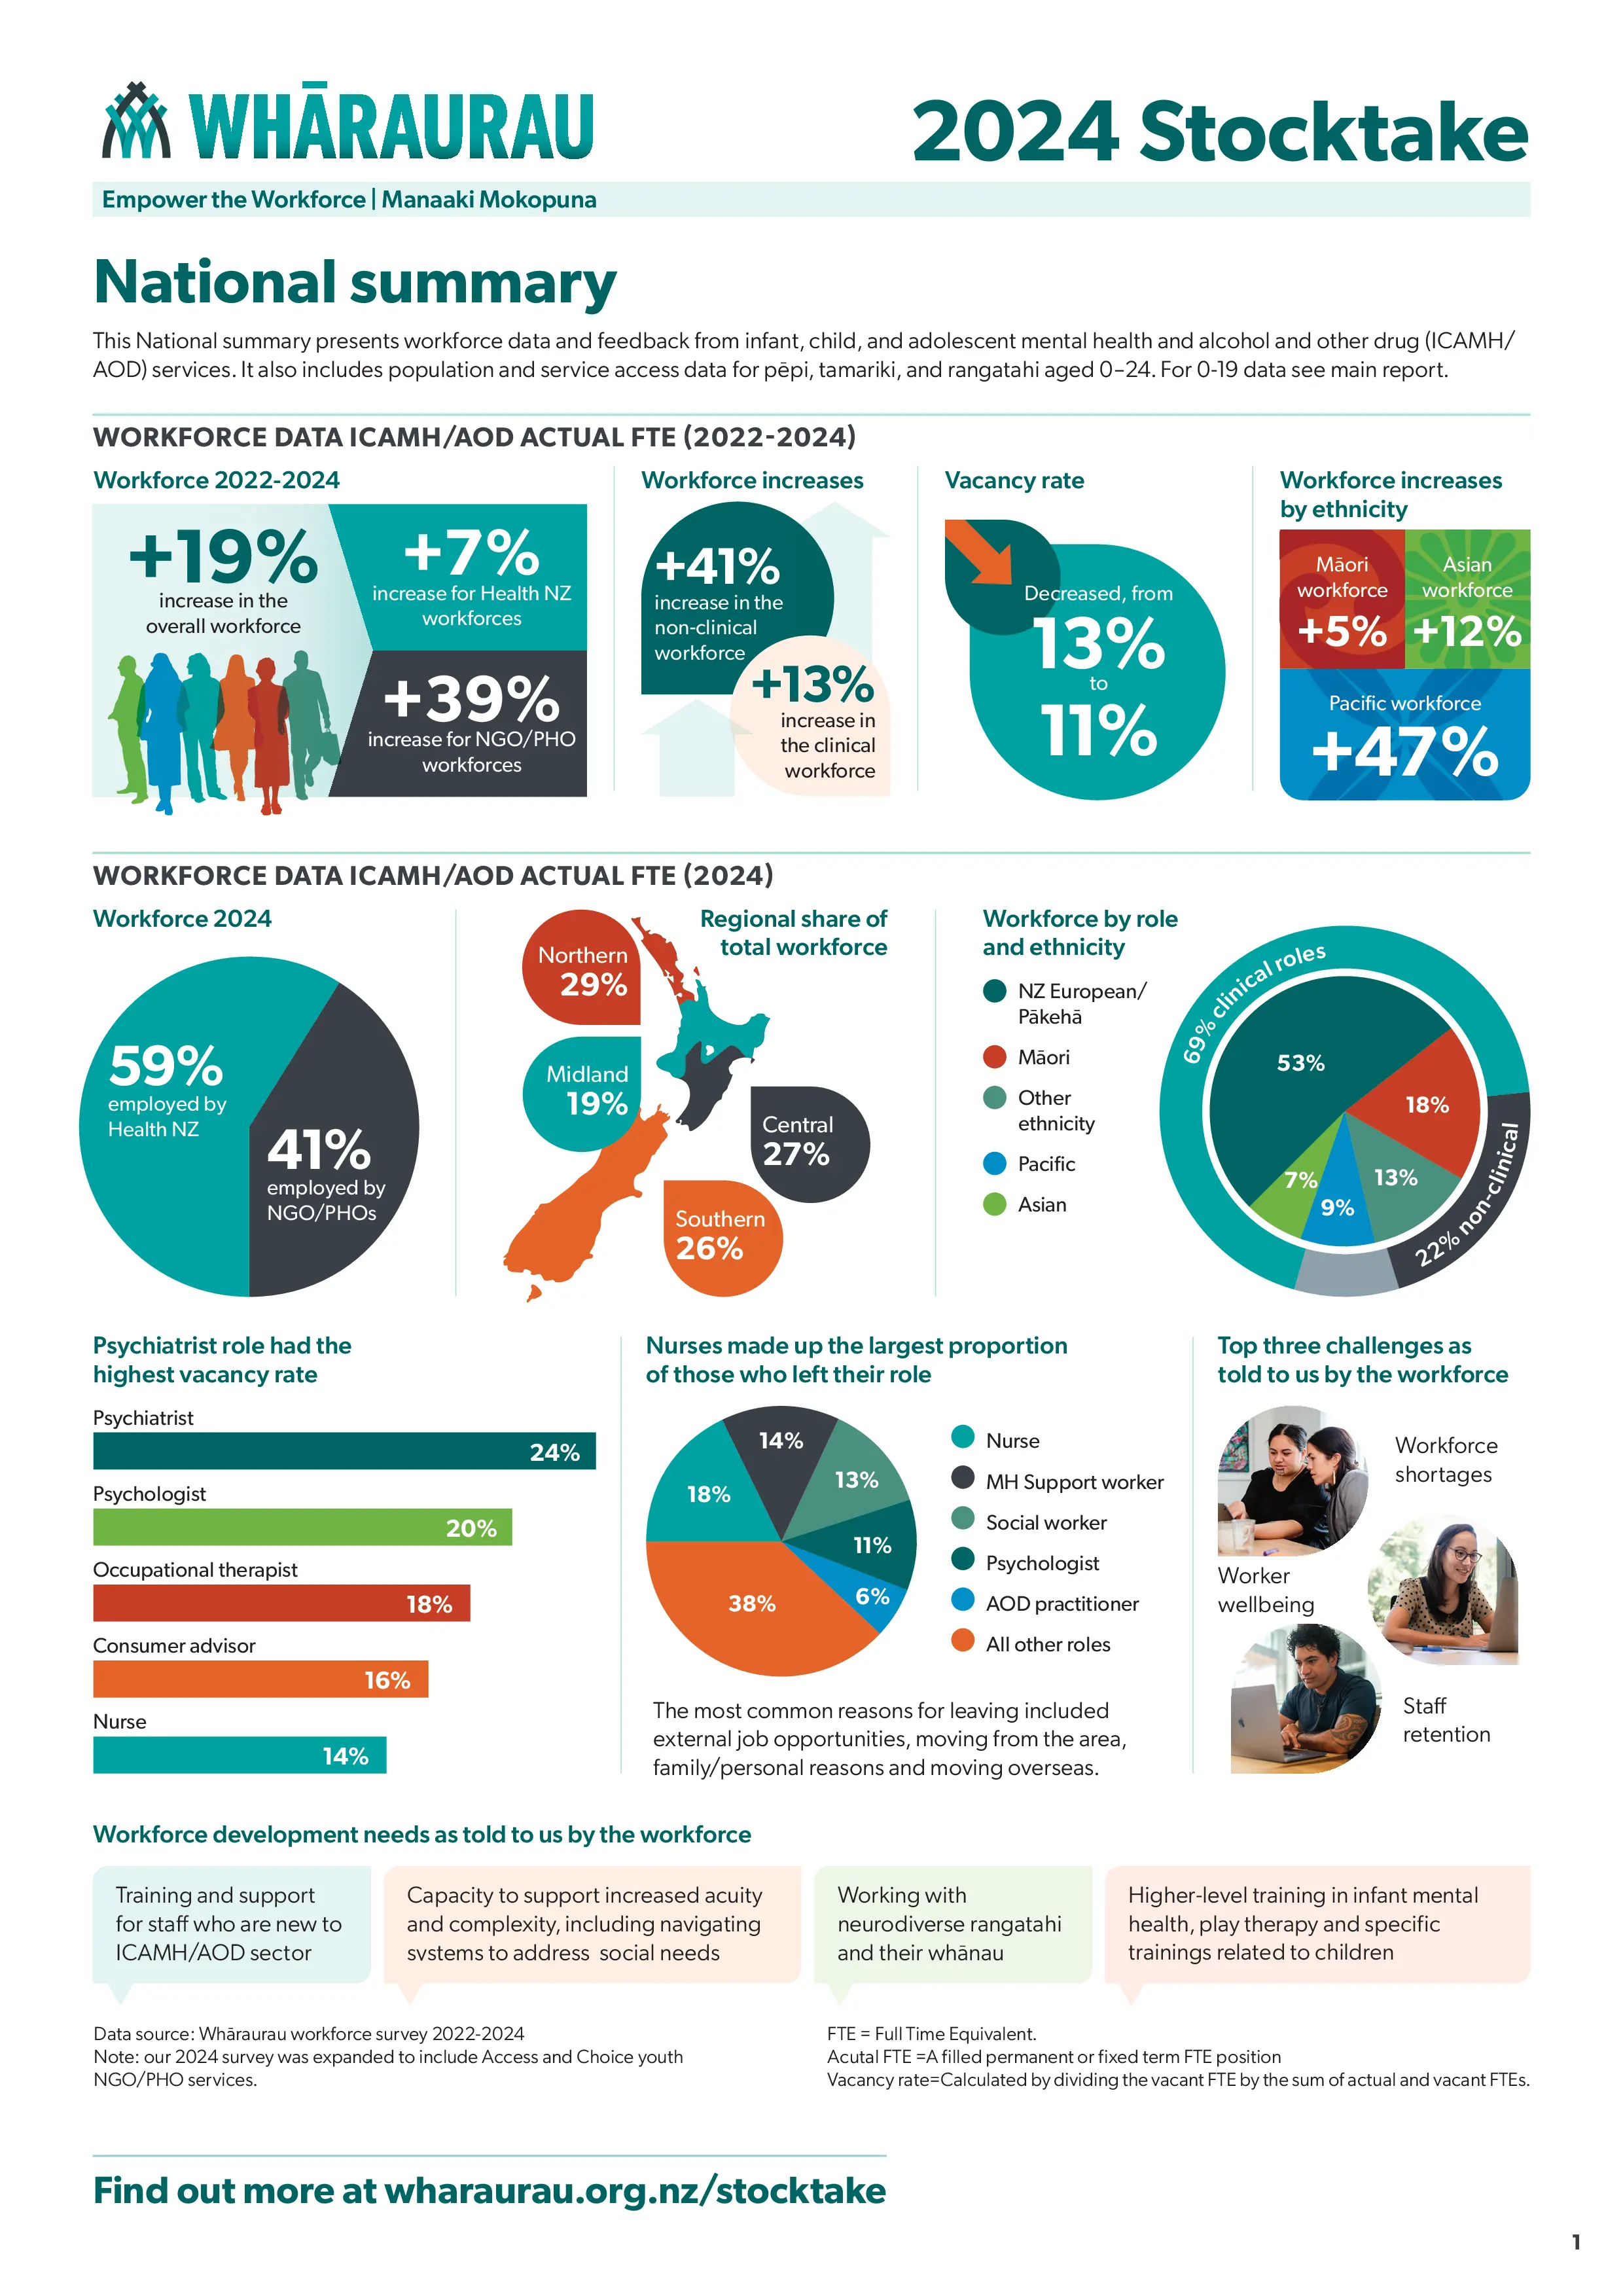
2024 Stocktake
View the 2024 ICAMH/AOD Stocktake report, including workforce data, and population and service access data for pēpi, tamariki, and rangatahi.
2022 Stocktake
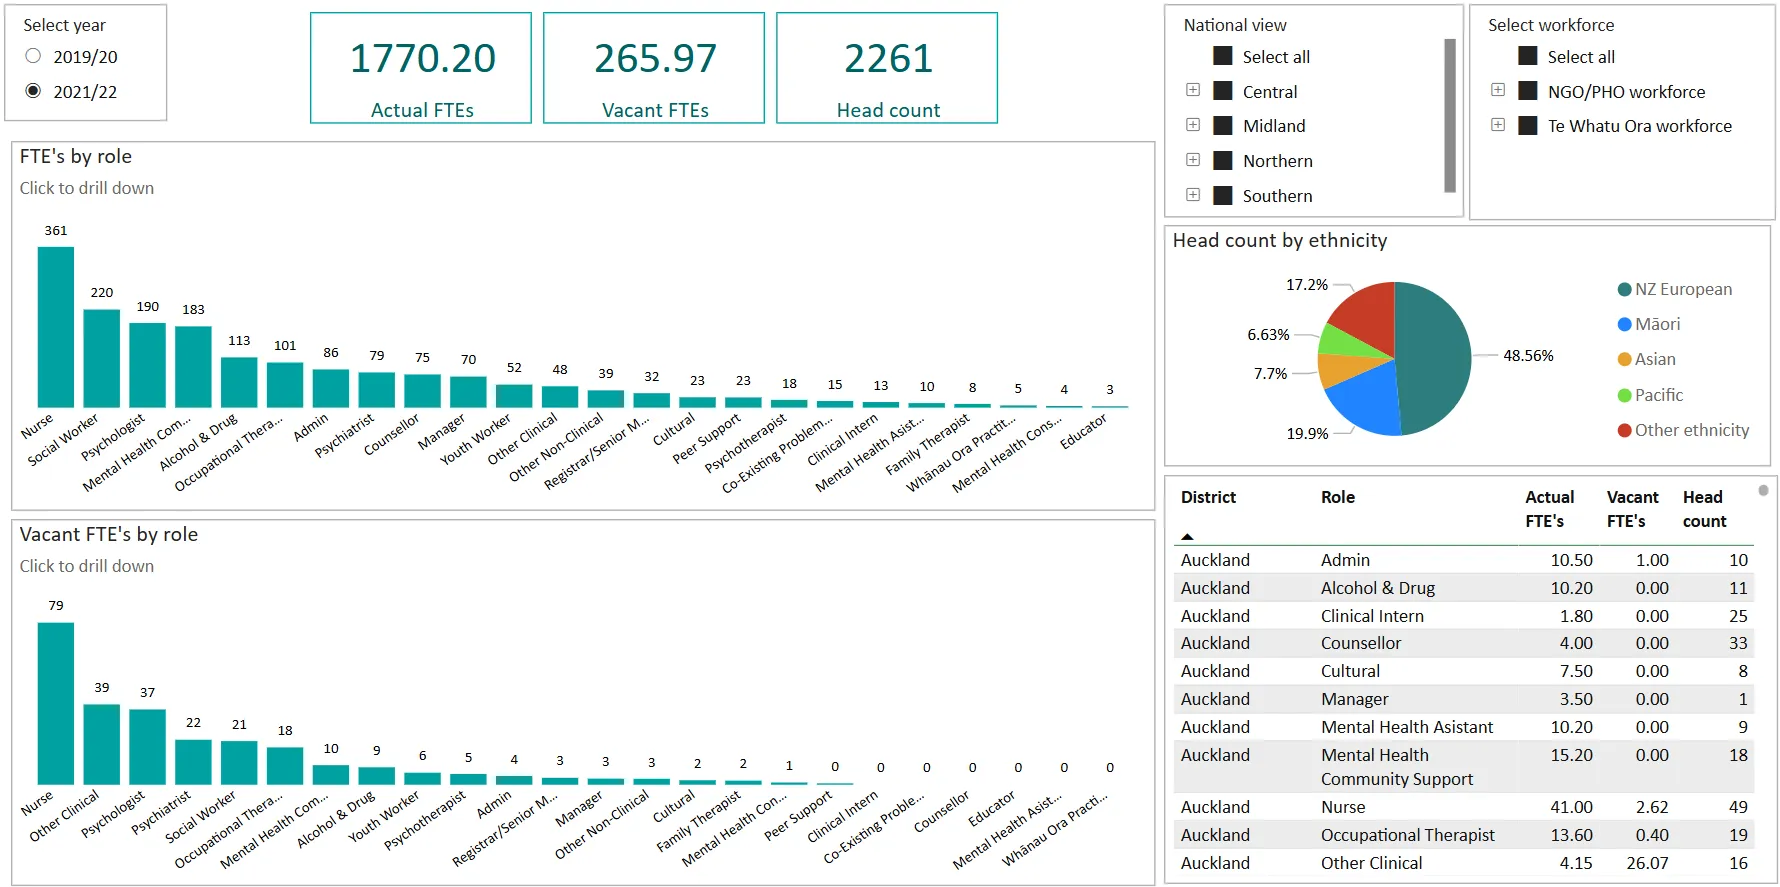
Stocktake dashboard
The stocktake dashboard provides actual and vacant FTE data within the Te Whatu Ora funded Infant, Child and Adolescent Mental Health/Alcohol and Other Drugs (ICAMH/AOD) sector. Actual and vacant FTE are broken down by role type and ethnicity and is available at a district level. The dashboard also contains information regarding role by ethnicity, workforce data over time and turnover rates by role type and reasons for turnover.
Data is collected using a workforce survey communicated via email and phone, and includes:
- Te Whatu Ora delivered inpatient and community ICAMH/AOD services
- Te Whatu Ora and Ministry of Health | Manatū Hauora funded NGO and PHO service providers contracted to provide ICAMH/AOD services, extracted from the Ministry of Health | Manatū Hauora Price Volume Schedule (PVS) and the Te Whatu Ora Contract Management System (CMS). For those who did not participate, data provided from the previous stocktake is used
Each page on this dashboard allows users to filter workforce data by region or district, and further filter by role type or ethnicity.
Using the national view filter, users can select all regions or filter by individual regions. The select workforce filter allows users to select all workforces or filter by specific workforces, for example NGO/PHO, Te Whatu Ora community, inpatient or National Youth Forensic.
Users can click on the role names within the graphs, to drill down further.
Users can compare and combine workforce data across different regions/districts, role types and ethnicities. This information can help users with research, or when planning workforce development activities within teams/services/areas. This dashboard can also help users to present data relating to capacity of the ICAMH/AOD workforce.
While respondents are supported to accurately complete the workforce survey, variations over time may still occur due to how different management respondents count their staff and each respondent’s understanding of how to complete the workforce survey. Analyses are adjusted as more accurate data is received. Changes in contracts may also contribute to observed variances.
- Ethnicity data is reported at management level and prioritisation of ethnicity in cases of mixed ethnicity is determined at this level. Hence, caution should be exercised when interpreting ethnicity data
- Headcount data may record the same individual more than once, as some individuals may work across different teams or services
- While these limitations apply to both Te Whatu Ora and NGO/PHO services, there are other factors that affect the quality of data from the NGO/PHO sector. Therefore, caution should be exercised when interpreting the information from this sector. These services:
- Often offer integrated support that covers all age groups. Determining the precise portion of FTE that falls under the Te Whatu Ora ICAMH/AOD contract is challenging for providers, often requiring estimation
- Have contracts that are held by a single lead provider with contracts devolved to a number of other providers. This level of detail may not be captured in the PVS or CMS therefore, services may be missed
- Receive funding from various sources (MSD, Accident Compensation Corporation, Youth Justice). Due to a diverse range of service provision, it can be challenging to determine the specific portion of funding allocated to the Ministry of Health | Manatū Hauora/Te Whatu Ora funded ICAMH/AOD contracts
- Often offer integrated support that covers all age groups. Determining the precise portion of FTE that falls under the Te Whatu Ora ICAMH/AOD contract is challenging for providers, often requiring estimation
- Have contracts that are held by a single lead provider with contracts devolved to a number of other providers. This level of detail may not be captured in the PVS or CMS therefore, services may be missed
- Receive a variable number of contracts from year to year; therefore, difficult to ascertain workforce trends over time
- Face challenges in recruiting and retaining qualified staff in rural areas
- Receive a variable number of contracts from year to year; therefore, difficult to ascertain workforce trends over time
- Face challenges in recruiting and retaining qualified staff in rural areas
- Receive funding from various sources (MSD, Accident Compensation Corporation, Youth Justice). Due to a diverse range of service provision, it can be challenging to determine the specific portion of funding allocated to the Ministry of Health | Manatū Hauora/Te Whatu Ora funded ICAMH/AOD contracts
FTE (Full Time Equivalent): Proportion of full-time hours worked (for some services 40 hours worked is considered full-time, whereas others consider 37.5 hours as full-time; both cases are treated the same (FTE=1).
Actual FTE: A filled permanent or fixed term FTE position (excluding casual employees).
Vacant FTE: An unfilled permanent or fixed term FTE position (excluding casual employees) that has funding allocated and will be actively recruited in the next six months.
You might also be interested in

Sign up to receive updates on training/events and online courses


Whāraurau is the national centre for Infant, Child and Adolescent Mental Health (ICAMH) workforce development.